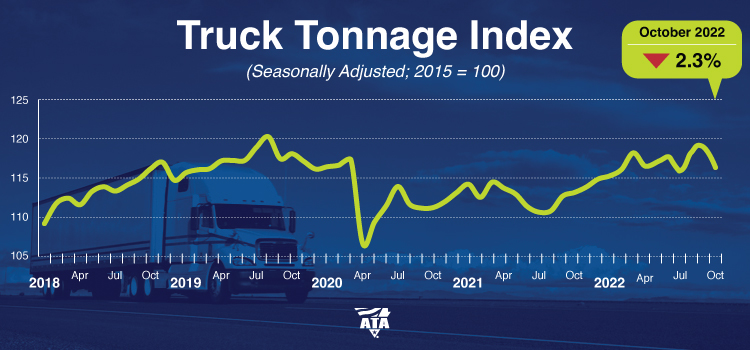
Washington — American Trucking Associations’ advanced seasonally adjusted (SA) For-Hire Truck Tonnage Index decreased 2.3% in October after rising 0.8% in September. In October, the index equaled 116.3 (2015=100) versus 119.1 in September.
“For-hire truck tonnage saw the largest single monthly decrease in October since the start of the pandemic,” said ATA Chief Economist Bob Costello. “The decrease fits with the anecdotal reports of a muted fall freight season. It also coincides with a slowing economy. Housing is a weak spot in freight in addition to a slowing in personal consumption of goods. While factory related freight is holding up better than other areas, it is also decelerating.”
September’s increase was revised up slightly from our October 18 press release.
Compared with October 2021, the SA index increased 2.8%, which was the fourteenth straight year-over-year gain, but the smallest gain since April. In September, the index was up 5.7% from a year earlier. Year-to-date through October, compared with the same period in 2021, tonnage was up 3.9%.
The not seasonally adjusted index, which represents the change in tonnage actually hauled by fleets before any seasonal adjustment, equaled 118.9 in October, 0.4% below the September level (119.3). In calculating the index, 100 represents 2015. ATA’s For-Hire Truck Tonnage Index is dominated by contract freight as opposed to spot market freight.
Trucking serves as a barometer of the U.S. economy, representing 72.2% of tonnage carried by all modes of domestic freight transportation, including manufactured and retail goods. Trucks hauled 10.93 billion tons of freight in 2021. Motor carriers collected $875.5 billion, or 80.8% of total revenue earned by all transport modes.
ATA calculates the tonnage index based on surveys from its membership and has been doing so since the 1970s. This is a preliminary figure and subject to change in the final report issued around the 5th day of each month. The report includes month-to-month and year-over-year results, relevant economic comparisons, and key financial indicators.