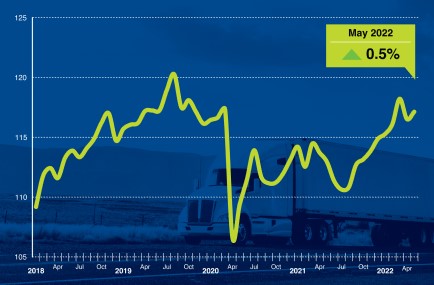
Washington — American Trucking Associations’ advanced seasonally adjusted (SA) For-Hire Truck Tonnage Index increased 0.5% in May after falling 1.4% in April. In May, the index equaled 117.1 (2015=100) versus 116.5 in April.
“The transition in the freight market continued in May with the index hitting the second highest level since the pandemic started. Specifically on the market transition, ATA’s tonnage index is dominated by contract freight. The traditional spot market has slowed as freight softens, but these contract carriers are backfilling any losses in freight with loads from shippers that is reducing spot market exposure,” said ATA Chief Economist Bob Costello. “Essentially the market is transitioning back to pre-pandemic shares of contract versus spot market.
“Overall, economic indicators that are important to trucking slowed in May, including retail sales, housing starts, and manufacturing output,” he said.
April’s decline was revised up from our May 24 press release.
Compared with May 2021, the SA index increased 3.7%, which was the ninth straight year-over-year gain and the largest since April 2021. In April, the index was up 2.5% from a year earlier. In 2022, year-to-date and compared with same period in 2021, tonnage was up 2.7%.
The not seasonally adjusted index, which represents the change in tonnage actually hauled by fleets before any seasonal adjustment, equaled 119.7 in May, 4.2% above the April level (114.8). In calculating the index, 100 represents 2015. ATA’s For-Hire Truck Tonnage Index is dominated by contract freight as opposed to spot market freight.
Trucking serves as a barometer of the U.S. economy, representing 72.5% of tonnage carried by all modes of domestic freight transportation, including manufactured and retail goods. Trucks hauled 10.23 billion tons of freight in 2020. Motor carriers collected $732.3 billion, or 80.4% of total revenue earned by all transport modes.
ATA calculates the tonnage index based on surveys from its membership and has been doing so since the 1970s. This is a preliminary figure and subject to change in the final report issued around the 5th day of each month. The report includes month-to-month and year-over-year results, relevant economic comparisons, and key financial indicators.