Index Fell 1.7% in 2023, Worst Year Since 2020
Washington — American Trucking Associations’ advanced seasonally adjusted For-Hire Truck Tonnage Index increased 2.1% in December after falling 1.4% in November. In December, the index equaled 115.7 (2015=100) compared with 113.3 in November.
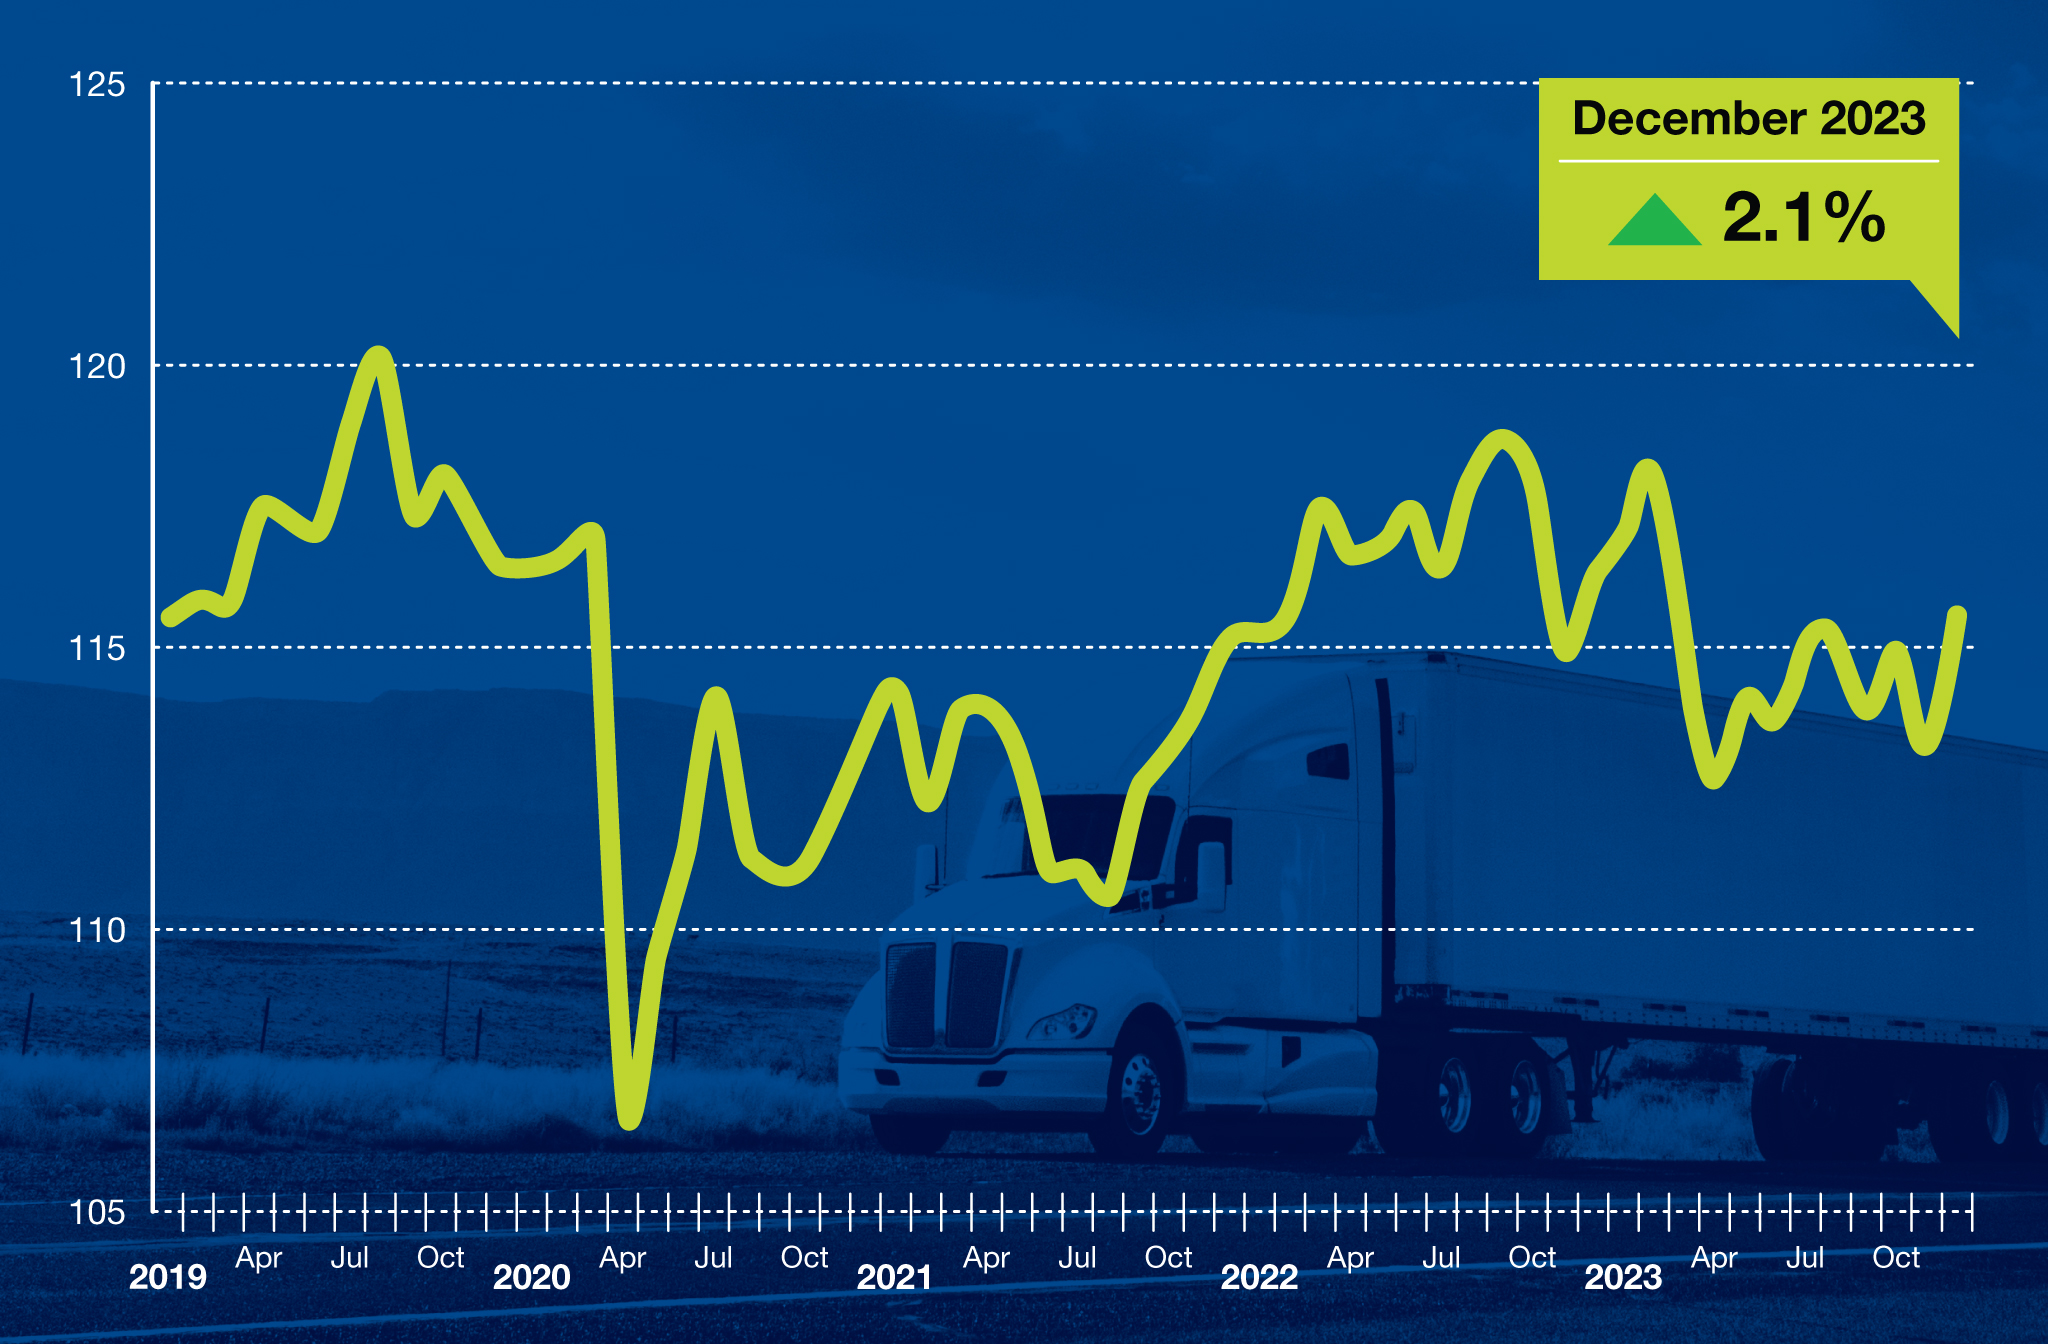
“While 2023 ended on a better note, truck tonnage remained in a recession as it continued to fall on a year-over-year basis,” said ATA Chief Economist Bob Costello. “With that said, for-hire contract freight, which is what comprises our index, in December was 2.6% above the trough in April. For the entire year, tonnage contracted 1.7% from 2022 levels. This makes 2023 the worst annual reading since 2020 when the index fell 4% from 2019, and the only year since 2020 that tonnage contracted.”
November’s decline was revised down slightly from our December 19 press release.
Compared with December 2022, the SA index fell 0.5%, which was the tenth straight year-over-year decrease, albeit the smallest over that period. In November, the index was down 1.6% from a year earlier.
The not seasonally adjusted index, which represents the change in tonnage actually hauled by the fleets before any seasonal adjustment, equaled 110.7 in December, 1.9% below November’s level (112.8). In calculating the index, 100 represents 2015. ATA’s For-Hire Truck Tonnage Index is dominated by contract freight as opposed to spot market freight.
Trucking serves as a barometer of the U.S. economy, representing 72.6% of tonnage carried by all modes of domestic freight transportation, including manufactured and retail goods. Trucks hauled 11.46 billion tons of freight in 2022. Motor carriers collected $940.8 billion, or 80.7% of total revenue earned by all transport modes.
ATA calculates the tonnage index based on surveys from its membership and has been doing so since the 1970s. This is a preliminary figure and subject to change in the final report issued around the 5th day of each month. The report includes month-to-month and year-over-year results, relevant economic comparisons, and key financial indicators.